The Spectral Lines of the Hydrogen Atom

The visible spectrum of light emitted by a hydrogen discharge tube. Image courtesy of Jan Homann.
When hydrogen atoms are subjected to large electric fields or to very high temperatures – above around 6,000°C – they produce light at a very particular set of wavelengths. The visible spectrum of this light is shown above, generating using a gas discharge tube, in which a very high voltage is placed across a chamber filled with hydrogen gas.
The light is produced because the electrons in the gas gain enough energy to fly off into space, rather than remaining in orbit around atomic nuclei.
At room temperature, and in the absence of large electric fields, electrons normally circle around the atomic nuclei in the gas – which in the case of hydrogen consist of a single proton. But if a large electric field is applied, this pulls the negatively charged electrons in one direction and the positively charged protons in the opposite direction. Beyond a certain strength of field, this force is strong enough to pull the two apart to form a plasma, in which protons and electrons move freely rather than being bound to each other.
But why does hydrogen produce light of such very specific wavelengths when this happens? The first clue came in 1885, when Johann Balmer observed that the wavelengths of the lines shown above followed a formula now known as the Balmer formula: \[ \lambda = B\left(\frac{n^2}{n^2-2^2}\right). \] Here, \(B\) is a constant with a value of 364.5 nm and \(n\) is an integer greater than two. A value of \(n=3\) returns \(\lambda=656.3\,\text{nm}\) – the red line on the far right of the spectrum above, called Hα. A value of \(n=4\) returns \(\lambda=486.1\,\text{nm}\) – the light blue line which is second from the right, called Hβ. And so the series continues, which each successive value of \(n\) giving the next line to the left.
The nomenclature here is that hydrogen lines are labelled H, and successive lines moving from right to left are labelled with successive letters of the Greek alphabet.
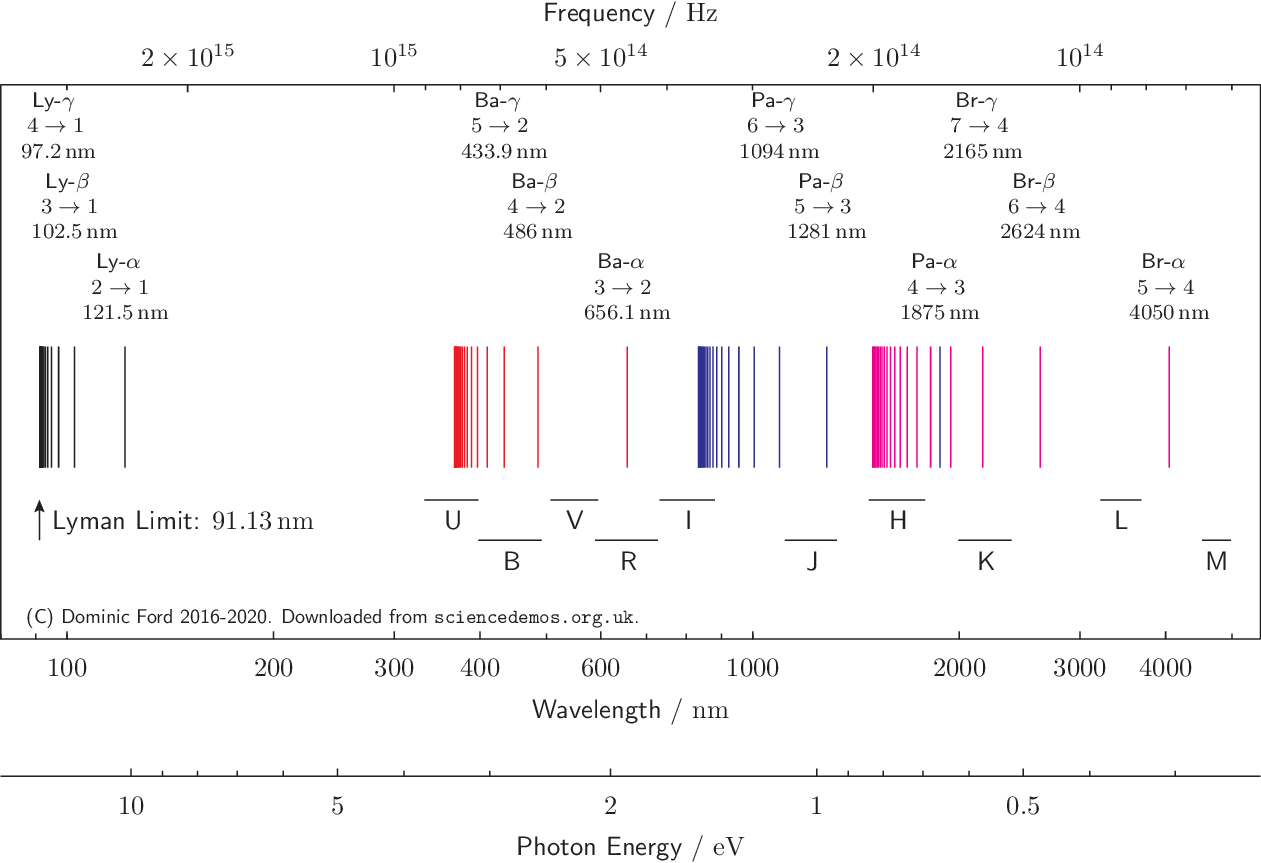
But in fact, whilst these were the first lines of the hydrogen atom to be discovered, because they fall in the visible part of the electromagnetic spectrum and therefore are easy to detect, they form part of a much wider spectrum which extends into both the ultraviolet and the infrared. This spectrum is shown below, and is also available in pdf format or png format.

The series of lines described by the Balmer formula are printed in red, and labelled as the Balmer series (Ba). The remaining lines follow a more general version of the Balmer formula discovered by Johannes Rydberg in 1888 and now known as the Rydberg formula: \[ \frac{1}{\lambda} = R_\text{H} \left(\frac{1}{n^2} - \frac{1}{m^2}\right). \]
The constant \(R_\text{H}\) equals \(4/B\), and \(m\) is an integer less then \(n\). Different values of \(m\) correspond to the different colored series of lines above, while different values of \(n\) (but always greater than \(m\)) correspond to each of the different lines in each series. A value of \(n=2\) corresponds to the Balmer series.
The lines are produced when electrons make transitions between the discrete set of orbitals which are allowed by quantum mechanics. The spectral lines whose wavelengths are given by the Rydberg formula correspond to transitions of electrons from the orbital with \(n\)th lowest energy, into the orbital with the \(m\)th lowest energy.
In the process, the electron reduces its energy, and this energy is released as a photon of light with a specific wavelength which corresponds to the amount of energy released by the electron.
The black series of lines correspond to electron transitions into the ground (m=1) state of the hydrogen atom from its excited states; it is termed the Lyman series. As before, lines within the series are assigned Greek letters depending upon the number of quantum states moved through. Thus, Lyα refers to the 2→1 transition, Lyβ refers to the 3→1 transition, and so forth.
The red series of lines correspond to electron transitions into the first excited (n=2) state; it is termed the Balmer series in Balmer's honor.
Since the Balmer series was the first series of hydrogen lines to be discovered, and since the lines fall within the visible part of the electromagnetic spectrum, they continue to be referred to by their historical names of simply Hα, Hβ, etc., where the H stands for hydrogen.
The blue and purple series of lines correspond to electron transitions into the n=3 and n=4 states, and are termed the Paschen and Brackett series. They fall in the infrared part of the electromagnetic spectrum.