Drawing the electromagnetic spectrum
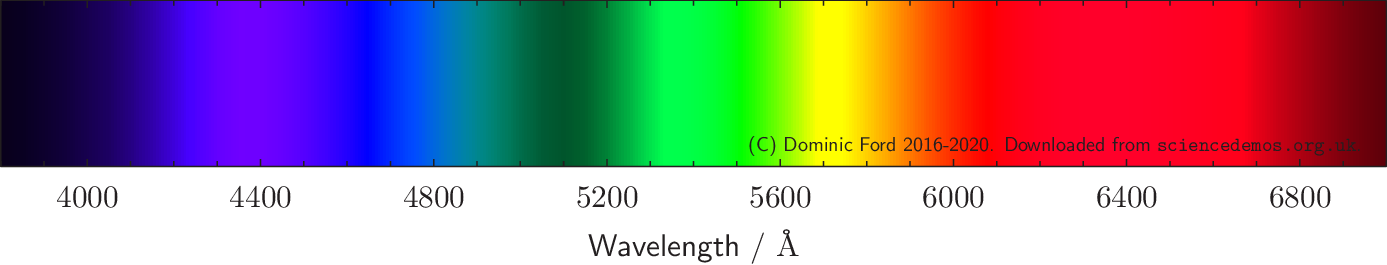
The tool above converts any specified wavelength of light within the electromagnetic spectrum into the RGB color which most closely approximates the color of such light.
To understand how this is done, it is first necessarily to appreciate that the human eye has three kinds of cone cells, which are sensitive to different colors. These are referred to as S (for "short") cells, with peak sensitivity around 4300 Â, M (for "middle") cells, with peak sensitivity around 5350 Â, and L (for "long") cells, with peak sensitivity around 5700 Â.
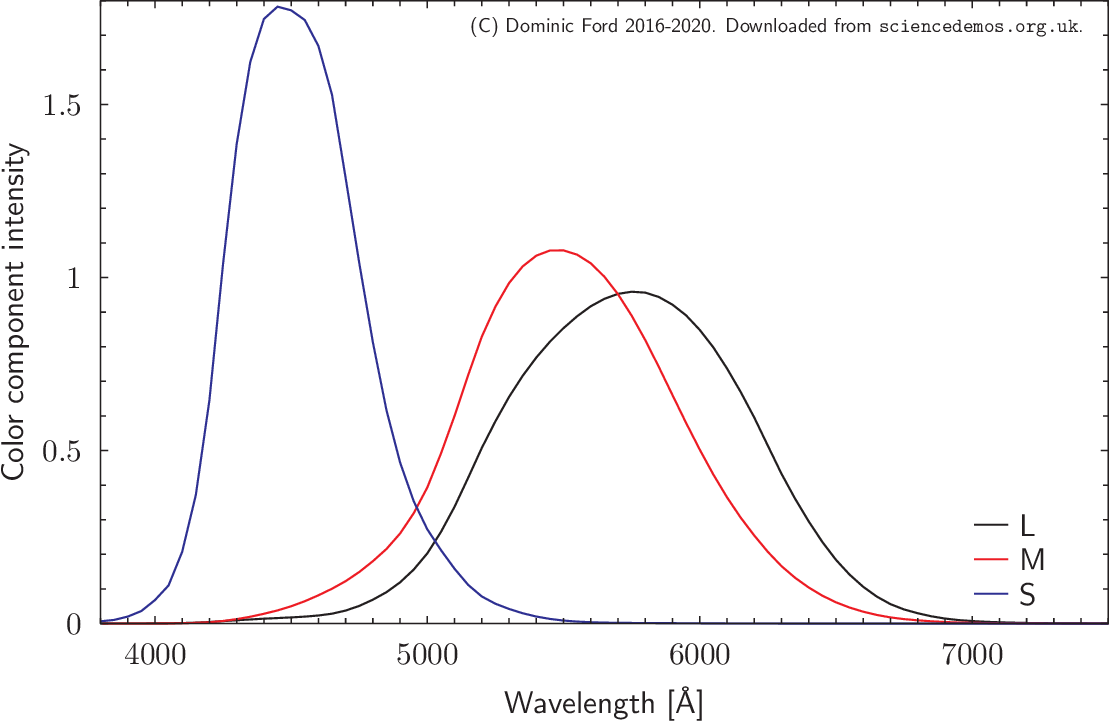
The stimulation of the three types of cone in the human eye, as a function of wavelength. Download image as pdf | png.
The sensitivity of these three types of cell to different wavelengths was measured in the late 1920s by William David Wright and John Guild, and their results were published by the International Commission on Illumination (CIE) as the "LMS color space". The graph to the right shows their results.
Thus, it is possible to express the eye's response to any given wavelength of light by the LMS values which represent the stimulation of its three kinds of color detector. More commonly, however, the eye's response to color is expressed in another color space: the XYZ color space.
The eye's response to light can be divided into the perception of luminance (i.e. brightness) and chromaticity (i.e. color). The perceived brightness of light is a response to the stimulation of all three types of cone cell, while the perceived color is due to the relative stimulation of the different types of cell.
In discussing color alone, it is useful to separate out brightness and color, so as to have a three-dimensional color space in which one axis (Y) represents perceived brightness, while two others (X and Y) represent color. This is especially useful since a two-dimensional space of different colors can be represented on a piece of paper, while the three-dimensional space of all possible LMS stimulation values cannot.
LMS color components can be straightforwardly converted into the CIE XYZ color space by a linear matrix transformation called the Hunt-Pointer-Estevez transformation:
\[ \begin{pmatrix} L \\\ M \\\ S \end{pmatrix} = \begin{pmatrix} 0.38971 & 0.68898 & -0.07868 \\\ -0.22981 & 1.18340 & 0.04641 \\\ 0.00000 & 0.00000 & 1.00000 \end{pmatrix} \begin{pmatrix} X \\\ Y \\\ Z \end{pmatrix} \]
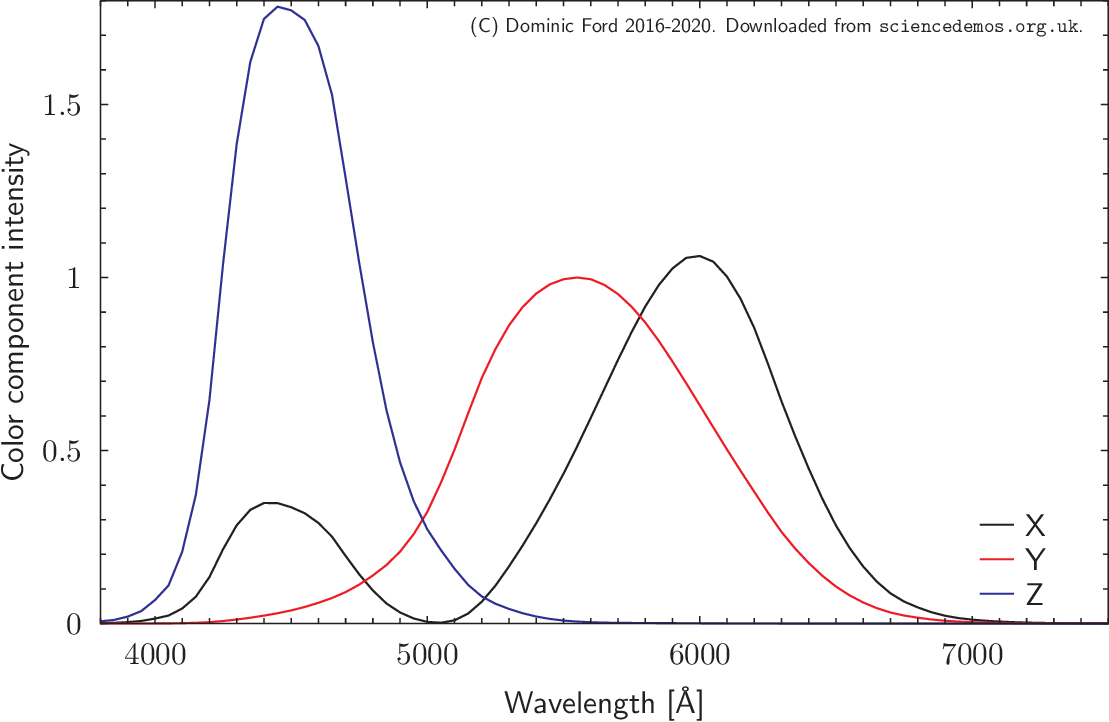
The plot to the right show the XYZ components of light as a function of wavelength. Broadly speaking, the Y component represents the perceived intensity of the light, the X component represents the perceived redness of the light, and the Z component is perceived blueness.
To represent the colors of the electromagnetic spectrum on a computer, the only remaining task is to compute which levels of RGB illumination from a computer display will produce the most similar stimulation to the eye's three types of cone as any particular wavelength of light. This is done as follows:
\[ \begin{pmatrix} R \\\ G \\\ B \end{pmatrix} = \begin{pmatrix} 3.50834 & -1.74095 & -0.54442 \\\ -1.06874 & 1.97721 & 0.03516 \\\ 0.05635 & -0.19711 & 1.05067 \end{pmatrix} \begin{pmatrix} X \\\ Y \\\ Z \end{pmatrix} \]
One remaining problem is that this matrix conversion very often produces negative RGB components, indicating that it is simply not possible to represent the exact colors of the electromagnetic spectrum on a computer screen. We deal with this by mixing white light to such RGB colors until all three components become positive. This will reduce the saturation of the color – tending to lead to pastel shades in preference to deep colors – but aims to give the best possible representation of the hue.